|
Map Sequence variability (H)
|

|
onto a 3D structure
|
|

|
This server maps the amino acid variability within a
protein sequence alignment onto a 3D structure.
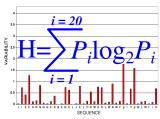
Variability is calculated using the Shannon Entropy equation (H),
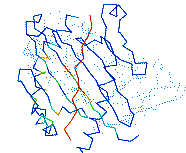
and it is mapped onto the 3D structure via a B factor.
- The server requires two inputs: 1) a multiple sequence alignment and 2) a PDB file with the 3D-coordinates of one of the sequences in the alignment.
- Sequence alignment must be in ClustalW format, and must be edited so that it is ungapped with regard to the sequence for which the 3D coordinates are provided.
- RES numbering in PDB must be consecutive and without missing or repeated RES numbers.
- IMPORTANT: Alignment and PDB files must be in TEXT format.
- We suggest that you use our newer version in which you do not need to edit your pdb file.
The server returns your input PDB with the sequence variability in the form of a B-factor.
Sequence variability can then be visualized using a variety of molecular graphics programs
by coloring the molecule by B-factor. Within
Rasmol, the most popular program for displaying molecular structures, variability is visualized by
simply selecting temperature in the Colours menu.
The color scale for the variability is the following:

where blue is conserved and red is variable
Shannon entropy calculations by Rob Meijers
Graphics and web programming by Pedro Reche
Hits since June/2002
 |
Last updated:
|
| This tool is also available at this
site
|
|
 |
|
|
| |
|
|