VARIABILITY METHODS
USER GUIDE
VARIABILITY METHODS
Shannon Entropy
Shannon entropy analysis (Shannon, 1948 ) is possibly the most sensitive
tool to estimate the diversity
of a system.
For a multiple protein sequence alignment,
the Shannon entropy (H) for every position is as follow:
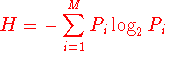
Where Pi is the fraction of residues of amino acid type
i, and M is the number of amino acid types (20).
H ranges from 0 (only one residue in present at that position) to 4.322
(all 20 residues are equally represented in that position). Typically,
positions with H >2.0 are considerered variable, whereas those with H < 2
are consider conserved. Highly conserved positions are those with H <1.0 (Litwin and Jores, 1992).
A minimum number of sequences is however required (~100) for H to describe the
diversity of a protein family.

Simpson
The Simpson index is another diversity index calculated from genotype proportions. Below is the
formula used to compute it:

This index describes the chance that two genotypes sampled at random and with replacement from
a community will be from the same species. The value of this index ranges between 0 and 1,
the greater the value, the greater the sample diversity.
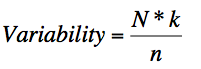
Wu-kabat
The Wu-Kabat variability coefficient is a well-established descriptor of the susceptibility of
an amino acid position to evolutionary replacements(1977). It highlights stretches of accentuated
amino acid variation. The variability coefficient is computed using the following formula:
USERGUIDE
Input
Protein Alignment
When this option is selected, a multiple sequence alignment in Clustal
format must be provided. Only the standard 20 amino acids should be
included in the alignment. If other sequence characters are included
(e.g. X) the server will return an error message.
A typical example of Clustal alignment is the following:
CLUSTAL W (1.81) multiple sequence alignment


hla_a68w_1HSB       SHSMRYFYTSVSRPGRGEPRFIAVGYVDDTQFVRFDSDAASQRMEPRAPWI
hla_a0201_1DUY      SHSMRYFFTSVSRPGRGEPRFIAVGYVDDTQFVRFDSDAASQRMEPRAPWI
hla_b3501_1A1N      SHSMRYFYTAMSRPGRGEPRFIAVGYVDDTQFVRFDSDAASPRTEPRPPWI
hla_b5301_1A1M      SHSMRYFYTAMSRPGRGEPRFIAVGYVDDTQFVRFDSDAASPRTEPRPPWI
hla_b5101_1E27      SHSMRYFYTAMSRPGRGEPRFIAVGYVDDTQFVRFDSDAASPRTEPRAPWI
hla_b2701_1HSA      SHSMRYFHTSVSRPGRGEPRFITVGYVDDTLFVRFDSDAASPREEPRAPWI
hla_cw3_1EFX        SHSMRYFYTAVSRPGRGEPHFIAVGYVDDTQFVRFDSDAASPRGEPRAPWV
hla-cw4_1IM9        SHSMRYFSTSVSWPGRGEPRFIAVGYVDDTQFVRFDSDAASPRGEPREPWV
mkb_2vaa            PHSLRYFVTAVSRPGLGEPRYMEVGYVDDTEFVRFDSDAENPRYEPRARWM
db-1BZ9             PHSMRYFETAVSRPGLEEPRYISVGYVDNKEFVRFDSDAENPRYEPRAPWM
                    .**:*** *::* **  **::: *****:. ******** . * ***  *:

hla_a68w_1HSB       RNTRNVKAQSQTDRVDLGTLRGYYNQSEAGSHTIQMMYGCDVGS
hla_a0201_1DUY      GETRKVKAHSQTHRVDLGTLRGYYNQSEAGSHTVQRMYGCDVGS
hla_b3501_1A1N      RNTQIFKTNTQTYRESLRNLRGYYNQSEAGSHIIQRMYGCDLGP
hla_b5301_1A1M      RNTQIFKTNTQTYRENLRIALRYYNQSEAGSHIIQRMYGCDLGP
hla_b5101_1E27      RNTQIFKTNTQTYRENLRIALRYYNQSEAGSHTWQTMYGCDVGP
hla_b2701_1HSA      RETQICKAKAQTDREDLRTLLRYYNQSEAGSHTLQNMYGCDVGP
hla_cw3_1EFX        RETQKYKRQAQTDRVSLRNLRGYYNQSEAGSHIIQRMYGCDVGP
hla-cw4_1IM9        RETQKYKRQAQADRVNLRKLRGYYNQSEDGSHTLQRMFGCDLGP
mkb_2vaa            RETQKAKGNEQSFRVDLRTLLGYYNQSKGGSHTIQVISGCEVGS
db-1BZ9             RETQKAKGQEQWFRVSLRNLLGYYNQSAGGSHTLQQMSGCDLGS
                     :*:  * : *  * .*     *****  ***  * : **::*.
PDB File
When this option is selected, the program will generate a multiple sequence
alignment from the sequence in the PDB file. Additionally, if a Chain identifier is given, the
program will select that chain from the PDB file. When no chain is provided, it will select the
first chain by default.
Options
Plot variability.
Plot variability consists of a graph of the sequence variability plotted against the selected
output sequence as shown below. When several variability methods have been selected,
their graphs can be displayed by clicking on the method name
Mask variability in sequence
This option masks in the selected reference sequence those residues with a variability
greater or equal than the selected variability threshold. The variability
masked sequence is returned in FASTA format (Shown below). When the user clicks on the 'Run Epitope
Prediction' button, the returned FASTA sequence will be sent to the RANKPEP algorithm for the
anticipation of conserved T-cell epitopes.
Conserved Fragments
This option identifies those fragments (minimum length selected by user) in the selected reference
sequence consisting of consecutive residues whose variability is under the variability threshold.
These fragments are returned in a table sorted by their position in the sequence alignment.
Since sequence variability provides a means by which some pathogens escape the immune system,
this option and that of the sequence variability masking are relevant for vaccine design considerations.
It is important however to notice that relevant antigenic regions can be composed of conserved and
variant regions. Unfortunatelly, these fragments will not appear in the conserved fragments ouput
if they do not have the minimum number of consecutives conserved residues selected by the user.
Map structural variability
This option maps the sequence variability onto a representative 3D-structure, using the PDB file
provided by the user. This is done using a JMOL applet, and for a correct visualization, javascript
must be enabled in the browser. By default, the 3-D structure is shown as 'wireframe', although other
display options can be selected by the user. For instance, in the image below, the selected option is
'trace'. The 'Back to original mapping' button will restore the sequence variability mapping when the
'Conserved Fragments' option has been selected and the user has clicked on a fragment to locate it
on the PDB file.
Shannon, C. E. (1948) The mathematical theory of communication.
The Bell system Technical Journal, 27, 379-423 & 623-656.
Kabat, E. A., Wu, T. T., and Bilofsky, H. (1977) Unusual distribution of amino acids
in complementarity-determing (hypervariable) segments of heavy and light chains
of immunoglobulins and their possible roles in specificity of antibody
combining sites.J. Biol. Chem.252, 6609-6616.
Litwin, S. and Jores, R. (1992) In theoretical and experimental insights
into immunology, (Edited by Perelson A. S. and Weisbuch G.), Springer-Verlag,
Berlin
Last change: November 2007