 |
 |
|
PCPS |
|
Proteasome Cleavage Prediction Server
|
 |
 |
The proteasome is the main responsible of proteolytic degradation of
cytosolic proteins, generating protein fragments between 7 and 15 amino
acids. Some of these peptides can be transported into the endoplasmic
reticulum by TAP. Whereas proteases of the endoplasmic reticulum trim
amino acids from the amino-terminus of the peptides the
carboxy-terminus of MHCI peptide ligands is generated by the
proteasome. Therefore the proteasome plays a central role in the MHCI
antigen processing pathway. There are two different proteasomes, the
constitutive proteasome, presented in all types of cells, and the
immunoproteasome, constitutively presented only in dendritic cells.
PCPS is a server for the prediction of cleavage sites generated by
both, the constitutive proteasome and the immunoproteasome

Input
Input query for PCPS can be one or more protein sequences in FASTA,
GenBank, EMBL or Phylip formats. Example of a protein sequence in FASTA
Format.
>A56881  PIR2 release 71.00
MWNLLHETDSAVATARRPRWLCAGALVLAGGFFLLGFLFGWFIKSSNEAT
NITPKHNMKAFLDELKAENIKKFLYNFTQIPHLAGTEQNFQLAKQIQSQW
KEFGLDSVELAHYDVLLSYPNKTHPNYISIINEDGNEIFNTSLFEPPPPG
YENVSDIVPPFSAFSPQGMPEGDLVYVNYARTEDFFKLERDMKINCSGKI
VIARYGKVFRGNKVKNAQLAGAKGVILYSDPADYFAPGVKSYPDGWNLPG
GGVQRGNILNLNGAGDPLTPGYPANEYAYRRGIAEAVGLPSIPVHPIGYY
DAQKLLEKMGGSAPPDSSWRGSLKVPYNVGPGFTGNFSTQKVKMHIHSTN
EVTRIYNVIGTLRGAVEPDRYVILGGHRDSWVFGGIDPQSGAAVVHEIVR
SFGTLKKEGWRPRRTILFASWDAEEFGLLGSTEWAEENSRLLQERGVAYI
NADSSIEGNYTLRVDCTPLMYSLVHNLTKELKSPDEGFEGKSLYESWTKK
SPSPEFSGMPRISKLGSGNDFEVFFQRLGIASGRARYTKNWETNKFSGYP
LYHSVYETYELVEKFYDPMFKYHLTVAQVRGGMVFELANSIVLPFDCRDY
AVVLRKYADKIYSISMKHPQEMKTYSVSFDSLFSAVKNFTEIASKFSERL
QDFDKSNPIVLRMMNDQLMFLERAFIDPLGLPDRPFYRHVIYAPSSHNKY
AGESFPGIYDALFDIESKVDPSKAWGEVKRQIYVAAFTVQAAAETLSEVA
Protein input sequence/s can be pasted or uploaded from a
local file. Sequence uploading is achieved in two sequential steps,
first browse/choose the local file with the sequences and second hit
the upload bottom. This is done to facilitate preprocessing and error
checking of input data prior to submission to the server.

Cleavage models
The user can select
a single cleavage prediction model, proteasome or immunoproteasome, or
both models simultaneously. The different available models correspond
to the constitutive proteasome (PCP-p) or the immunoproteasome
(PCP-ip), models were trained on 382 MHCI-eluted peptide ligands and
553 CD8 T cell epitopes and their flanking regions, respectively.PCPs
were obtained using N-GRAM-COUNT and tested using HIDDEN-NGRAM.
Different models were obtained from different training sets consisting
of peptide fragments containing the carboxy-terminus (P1 residue of
cleavage site) of the MHCI-restricted peptides (MHCI-eluted peptides
and CD8 T cell epitopes) and a variable number of flanking residues.
The predictive cleavage models for proteasome (PCP-p) and
immunoproteasome (PCP-ip) available in PCPS are the following:
| Model |
Frag. Size (N) |
SE |
SP |
ECS |
MCC |
BTR |
| model 1: PCP-p12 |
12 |
0.87 (± 0.03) |
0.53 (± 0.06) |
0.35 (± 0.02) |
0.43 (± 0.07) |
0.53 (± 0.02) |
| model 2: PCP-p8 |
8 |
0.85 (± 0.04) |
0.60 (± 0.05) |
0.38 (± 0.02) |
0.47 (± 0.07) |
0.47 (± 0.02) |
| model 3: PCP-p6 |
6 |
0.79 (± 0.05) |
0.72 (± 0.04) |
0.52 (± 0.08) |
0.36 (± 0.02) |
0.43 (± 0.03) |
| model 1: PCP-ip12 |
12 |
0.90 (± 0.03) |
0.41 (± 0.03) |
0.46 (± 0.01) |
0.36 (± 0.06) |
0.44 (± 0.01) |
| model 2: PCP-ip8 |
8 |
0.91 (± 0.02) |
0.54 (± 0.04) |
0.51 (± 0.01) |
0.48 (± 0.06) |
0.39 (± 0.01) |
| model 3: PCP-ip6 |
6 |
0.76 (± 0.04) |
0.71 (± 0.04) |
0.39 (± 0.01) |
0.47 (± 0.07) |
0.38 (± 0.02) |
Frag. Size (N): This is the
size of the peptide fragments in training and testing sets.
SE: Sensitivity.
SP:Specificity.
ECS: Expected Cleavage
Sites. Calculated using the equation 100*C/(N-1) where C is the average
number of cutpoint per fragment yield by a given model LMPCP when
tested in a file of fragments size N.
MCC: Matthews Correlation
Coefficient.
BTR: Better Than Random.
Calculated as the difference between SE and ECS (BTR = SE - ECS). The
bigger the difference between SE and ECS the better the prediction
capacity of the model.

Output
There are two posibles output acording the user detition:
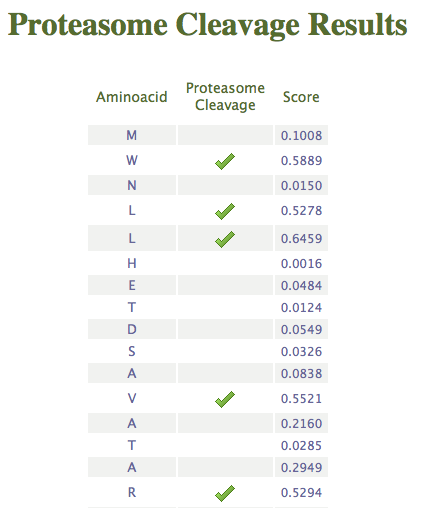
- Residues: Cleavage Sites per residue
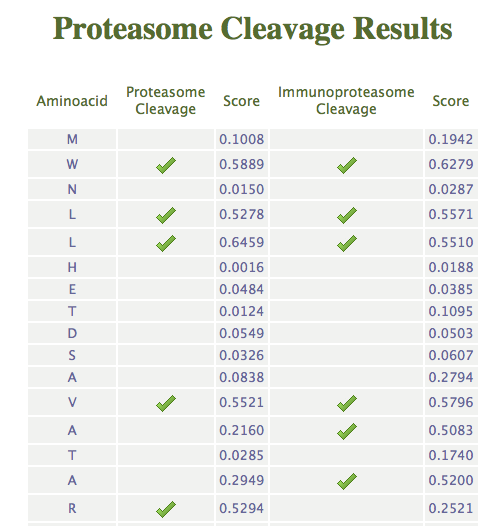
The server will compute cleavage prediction after each residue of the
protein by the proteasome and/or the immunoproteasome and return a
table with all the residues and their cleavage prediction score,
marking with a tick when the score is higher than the threshold value. This threshold value can be selected by
the user in the option "Threshold".
When both, proteasome and
immunoproteasome, are selected, the server return a table with both
cleavage predictions. Here follows a representative output taking as theshole value 0.5.
- Peptides: Peptides with
Cleavage sites at C-terminus
At the begining of the page, if the option "Graphics" is
selected,
a figure will be displayed indicating the position of each
epitope in the sequence. As it is show here, the sequence is
represented as a black fine line, while the diferent epitopes are
represented in blue boxes unther the black line. Here follows a
representative output.
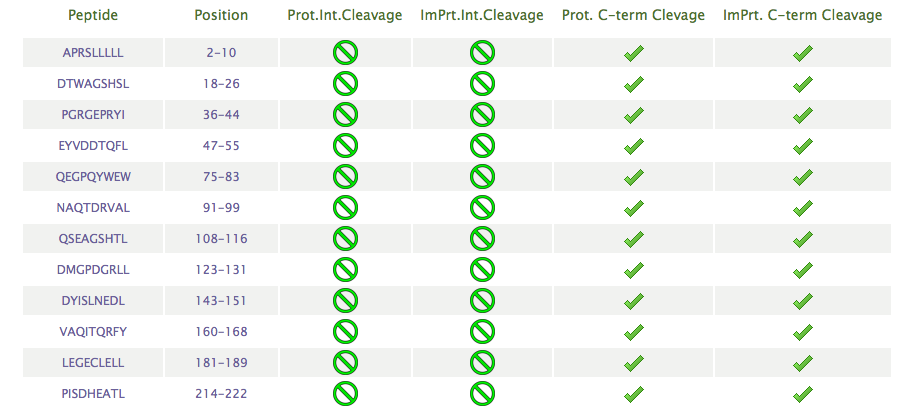
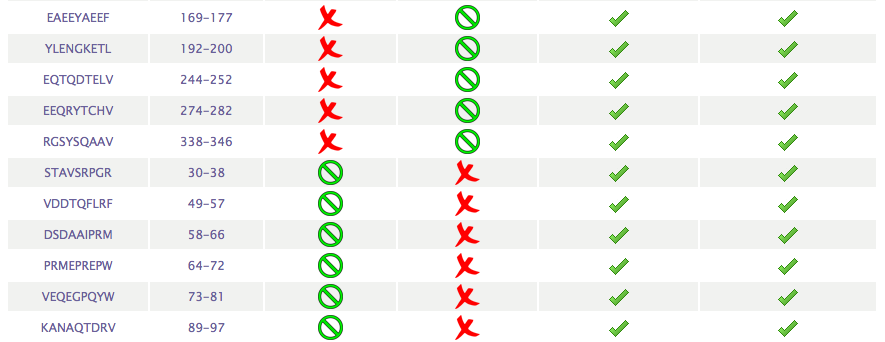
The server will also return a table
showing a list of peptides, size selected by the users, with
predicted cleavage after the C-terminal end: cleavage score above the
the threshold value choosen
by the user in the "Threshold"options.
For each peptide, it will also be indicated if there is NO internal
cleavage sites (labelled with a green cross) within the peptide or if there IS internal cleavage sites (labelled with a red cross)
site (with a red cross). A peptide with an internal cleavage site means that
there is at least site within the peptide with a cleavage score above the threshold for internal cleavage sites selected by users.
Users can select to discard peptides with internal cleavage sites from the input page.
Here follows a representative output.


Last change: March 2020


